Valley of Fire Weather and Heat Safety
Heat, rainfall and seasonal trail closures at Valley of Fire
Summer heat and trail closures
Summer temperatures at Valley of Fire can vary widely between day and night. Hiking in high heat is dangerous even on shorter trails, and hydration and electrolyte replacement are extremely important. Staying hydrated and preparing for the heat is the stated expectation for anyone hiking in high heat, and the danger covers short trails as well. Trails at Valley of Fire often feel much longer than listed, a result of the terrain and weather.
Many Valley of Fire trails are closed annually from May 15 to September 30 for safety. During that period the trails have a history of frequent medical calls, search and rescue missions, and fatalities.
Daily maximum temperatures at Overton
Overton, Nevada's mean daily maximum temperature, averaged over 1991 to 2020, is 62.1 °F (16.7 °C) in January and 75.2 °F (24.0 °C) in March. In June it is 104.2 °F (40.1 °C), in August 107.4 °F (41.9 °C), and in November 71.3 °F (21.8 °C). The chart below plots these five monthly figures in degrees Fahrenheit.
Long-term monthly averages for the months with a recorded figure.
| Item | Value (°F) |
|---|---|
| January | 62.1 |
| March | 75.2 |
| June | 104.2 |
| August | 107.4 |
| November | 71.3 |
Daily mean temperatures at Overton
Overton, Nevada's daily mean temperature in January is 47.7 °F (8.7 °C). In April the daily mean is 66.7 °F (19.3 °C), and in June it is 85.8 °F (29.9 °C). September has a daily mean of 82.6 °F (28.1 °C), and November has 55.4 °F (13.0 °C). All five figures are 1991 to 2020 averages.
Overnight lows at Overton
The 1991 to 2020 averages for Overton, Nevada include the mean daily minimum temperature for five months, listed here in Fahrenheit with the Celsius value in brackets.
- February: mean daily minimum of 37.6 °F (3.1 °C)
- April: mean daily minimum of 50.2 °F (10.1 °C)
- July: mean daily minimum of 74.7 °F (23.7 °C)
- September: mean daily minimum of 65.1 °F (18.4 °C)
- December: mean daily minimum of 32.4 °F (0.2 °C)
Seasons and rainfall
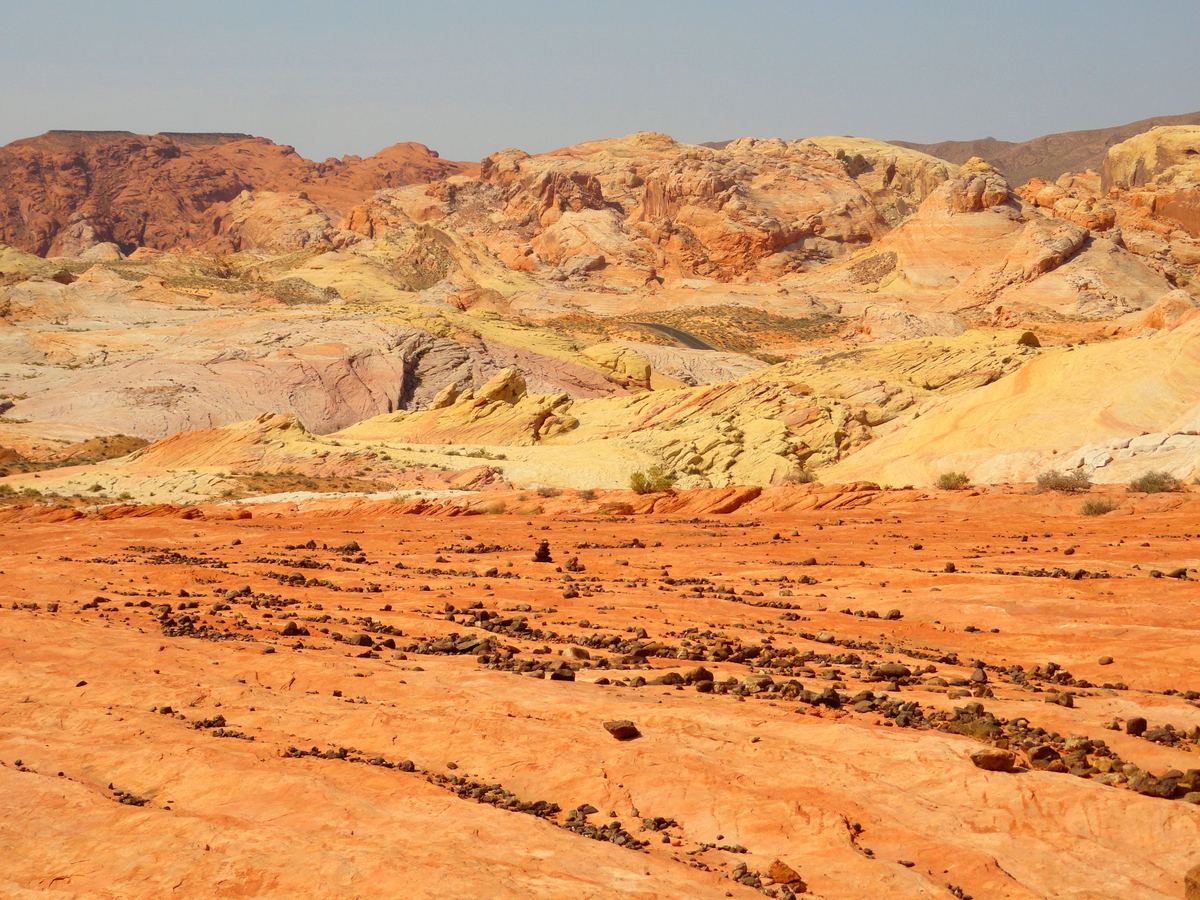
Spring and fall are the preferred seasons for visiting Valley of Fire. The springtime bloom of desert marigold, indigo bush and desert mallow is often spectacular along park roads. Average annual rainfall is four inches, coming from light winter showers and summer thunderstorms.
Monthly records from Overton, Nevada give average precipitation for five months, and a second set counts the days with at least 0.01 in of precipitation. Both are 1991 to 2020 averages.
| Month | Average precipitation |
|---|---|
| February | 0.91 in (23 mm) |
| May | 0.14 in (3.6 mm) |
| July | 0.38 in (9.7 mm) |
| October | 0.48 in (12 mm) |
| December | 0.64 in (16 mm) |
| Month | Days with precipitation |
|---|---|
| March | 3.0 days |
| May | 1.3 days |
| August | 2.2 days |
| October | 1.9 days |
Rides, parking and regional information
In the park, Uber and Lyft users may find themselves stranded when no return ride is on offer. Rides booked through Uber or Lyft to the park carry the same risk, with return rides often unavailable. Visitors may park only in designated places along the roadside shoulders, and motor vehicles are not allowed on trails. The park directs visitors seeking regional information to the Moapa Valley and Mesquite Chambers of Commerce.
Tours and activities
Tours and activities
Weather and safety questions
Frequently asked questions
When are many Valley of Fire trails closed?
Many trails are closed every year from May 15 to September 30 for safety. In that period the trails have a history of frequent medical calls, search and rescue missions, and fatalities.
How much rain does Valley of Fire receive?
Average annual rainfall is four inches, from light winter showers and summer thunderstorms.
Which seasons are preferred for visiting?
Spring and fall are the preferred seasons. In spring, desert marigold, indigo bush and desert mallow bloom, often spectacularly, along park roads.
Do summer temperatures change between day and night?
Summer temperatures at Valley of Fire can vary widely between day and night.
Is hiking in the heat risky on short trails?
Hiking in high heat is dangerous even on short trails, and hydration and electrolyte replacement are extremely important. Trails also often feel much longer than listed because of the terrain and weather.
What kind of rock is found at Valley of Fire?
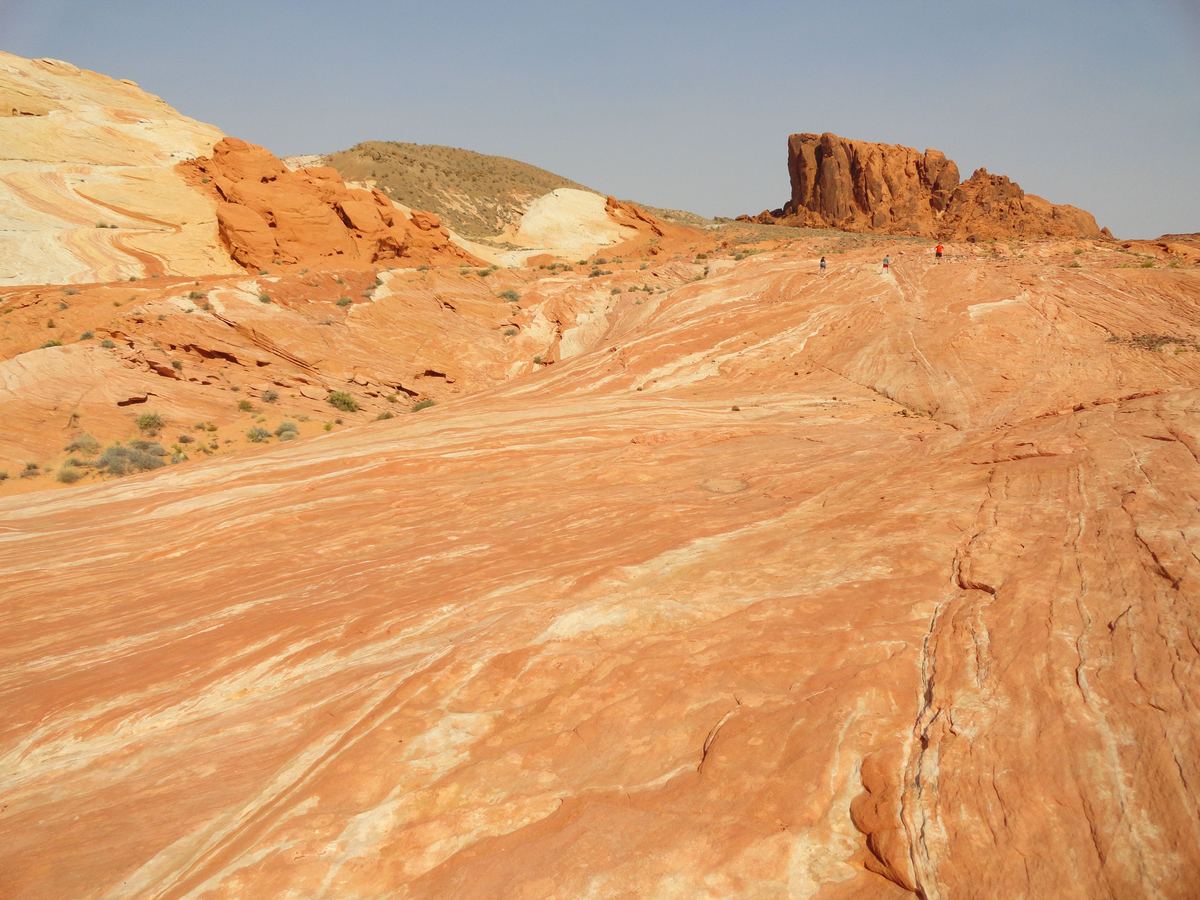
Remnants of ancient dunes appear as Aztec sandstone in the Bowl of Fire in the Lake Mead area near the park. The sandstone dates to the Jurassic period and is the remnant of wind-deposited sand.
Where may vehicles be parked?
Parking is permitted only in designated places along the roadside shoulders, and motor vehicles are not allowed on trails.